
It starts the same way for most families. A conversation about responsibility, a firm decision that things need to change, maybe even a handwritten list on the fridge. For a few days, it works. You remind, they do. Progress. Then life gets busy, the reminders multiply, the list fades into the background clutter of family life, and within two weeks you’re back to nagging, they’re back to ‘forgetting’, and the whole thing feels like yet another parenting initiative that didn’t stick.
Sound familiar? You’re not failing at parenting. You’re failing at system design. And the fix is simpler than you might think.
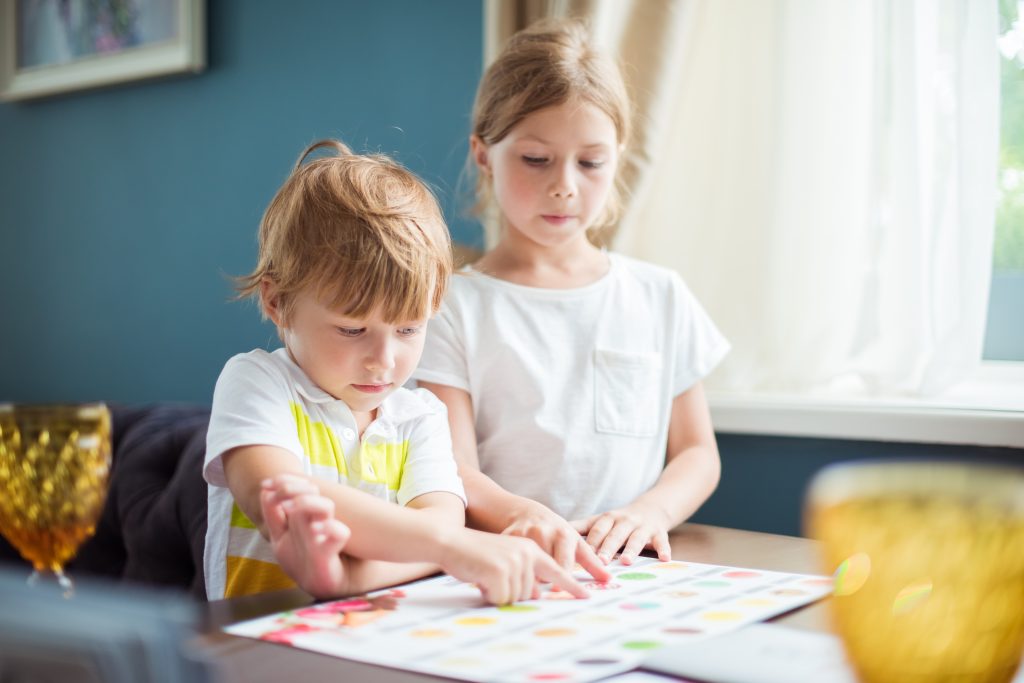
A well-designed visual chore chart is one of the most consistently effective parenting tools in existence. Not because it’s magic, and not because children suddenly love doing chores when there’s a chart involved. But because it works with the way children’s brains actually function — visually, concretely, and with immediate feedback — rather than against it. When a chore chart is set up correctly and used consistently, it changes the dynamic of the entire chore conversation in your household.
This guide covers everything: the psychology of why visual systems work, the anatomy of a chart that actually gets used versus one that gets ignored, how to introduce and maintain the system, how to keep it fresh as your child grows, and ultimately how to use it as a bridge toward something more lasting than compliance — genuine internal motivation. And throughout, we’ll look at what makes a great chart great, so you know exactly what to look for when you’re ready to put one in place.
Why Visual Systems Work: The Psychology Behind the Chart
Before we get practical, it’s worth understanding why a visual chore chart works when a verbal request or a written list often doesn’t. The answer lies in how children’s brains process information, manage attention, and form habits.
Research in cognitive neuroscience consistently shows that the human brain processes visual information approximately sixty thousand times faster than text. For children, who are still developing their verbal processing and working memory systems, this gap is even more pronounced. A visual cue — a chart on the wall with clear images, colours, and boxes to fill in — is registered faster, retained longer, and recalled more easily than a verbal instruction delivered in the moment.
This is why a chore chart on the bedroom door is more effective than a parent’s voice saying the same thing. It’s not that the chart is louder or more authoritative. It’s that it speaks in a language the brain is better equipped to receive.
One of the most underappreciated benefits of a chore chart is what it does to the parent-child dynamic around chores. When the expectation lives in your head and is delivered through your voice, the chore request is a personal interaction. Your child is responding — or not responding — to you. That interaction carries all the weight of your relationship, your authority, their autonomy, and whatever mood everyone is in that day.
When the expectation lives on a chart on the wall, the interaction changes completely. The chart says it’s time, not you. The child is responding to a system, not to a person. This removes the personal charge from the chore request, reduces the likelihood of a power struggle, and — critically — preserves your relationship as the warm, supportive presence rather than the enforcer. Parents who use chore charts consistently report that the number of chore-related arguments in their household decreases significantly. The chart absorbs the conflict.
There is something deeply satisfying about marking a task complete. The act of ticking a box, placing a sticker, or flipping a magnet from one side to the other triggers a small but genuine dopamine release — the brain’s reward chemical. This is why to-do lists feel good to complete, why adults use habit trackers, and why video games are so effective at sustaining engagement: they are built around a constant loop of task completion and visible reward.
A well-designed chore chart harnesses exactly this mechanism. The completion marker isn’t just a record — it’s a reward in itself. Over time, the act of completing the chore becomes associated with the positive feeling of marking it done, which reinforces the behaviour neurologically. This is habit formation at its most fundamental: a trigger, a routine, and a reward.
Executive function — the set of cognitive skills that includes planning, sequencing, task initiation, and working memory — is still actively developing throughout childhood and into early adulthood. Chores require executive function, which is partly why children struggle with them. A visual chore chart functions as an external executive function scaffold: it does the planning and sequencing work for the child, reducing the cognitive load of figuring out what needs to happen and allowing them to focus on actually doing it.
This is especially valuable for children with ADHD, sensory processing differences, or other executive function challenges. For these children, a visual system isn’t just helpful — it can be genuinely transformative.
Children thrive on predictability. Knowing what is coming, what is expected, and what the structure of the day looks like reduces anxiety, improves emotional regulation, and increases cooperation. A chore chart is a form of predictability: the same tasks, on the same days, represented in the same visual format. There are no surprises. No shifting expectations. No wondering what you’ll be asked to do today.
For children who struggle with transitions or uncertainty — which includes a very large proportion of children at various developmental stages — this predictability is enormously settling. The chart isn’t just a task list. It’s a form of structure that communicates safety.
What Makes a Great Chore Chart: The Anatomy of a System That Gets Used
Not all chore charts are created equal. The difference between a chart that transforms your household and one that gets ignored within a week comes down to design. Here is what separates the ones that work from the ones that don’t.
A chart needs to communicate its expectations at a glance, without explanation. For younger children, this means using images alongside or instead of text — a picture of a toothbrush next to the words ‘brush my teeth’, a bed illustration next to ‘make my bed’. For older children and teenagers, clear text with a clean layout is sufficient, but the design still matters. A chart that is cluttered, hard to read, or visually unappealing will be ignored. A chart that is clear, well-designed, and pleasant to look at will be engaged with.
This sounds trivial, but it isn’t. Children interact with their environment aesthetically in a way adults often underestimate. A chart that looks like it was made with care — that has colour, visual hierarchy, and thoughtful design — signals that this matters. A chart that looks like it was thrown together communicates the same.
A chart that lives in a drawer is not a chart — it’s a piece of paper. For a visual system to work, it needs to be visible as part of the child’s daily environment. The bedroom door is ideal: the child sees it when they wake up and when they go to bed. The kitchen wall near the breakfast area is excellent for morning chore prompts. A shared family hallway works well for multi-child households.
The location should be chosen so that the chart is visible at the time the chores are due to happen. A morning chore chart should be somewhere the child sees it in the morning. An evening chore list should be in the evening flow path. Proximity to the trigger moment is everything.
The completion mechanism is arguably the most important design element of a chore chart. This is the thing the child does when they’ve finished a task, and it needs to feel genuinely satisfying to be effective. Options range from dry-erase marker tick boxes (which can be wiped and reset each week) to magnetic sliders, velcro tabs, sticker charts for younger children, and reusable sticker systems for older ones.
The key qualities of a good completion mechanism are: it is physical (you do something with your hands, not just look at a screen), it is immediate (you mark it the moment the task is done), it is visible (you can see your progress at a glance), and it is resettable (the chart resets weekly, maintaining freshness and the ongoing reward of completion).
More is not better. A chart with fifteen daily tasks is overwhelming and demoralising. A chart with two tasks is too thin to be meaningful. The sweet spot for most children is between four and eight tasks per day, depending on their age and the complexity of the tasks. Start at the lower end — better to have a chart that is consistently completed than one that is consistently abandoned halfway.
Tasks should be specific enough that the child knows exactly what done looks like. ‘Tidy your room’ is too vague for most children. ‘Put toys in the toy box, clothes in the laundry basket, and books on the shelf’ is clear. Clarity removes the argument about whether the task has actually been done.
The charts that get used are the ones children feel some ownership over. This can be as simple as letting your child choose which chores go on the chart (from a list of appropriate options), choose the colour scheme or design, or decide where it hangs. Older children might help design their own chart entirely. The more a child has contributed to the creation of the system, the more invested they are in its success.
This is not about giving children unlimited choice — the chores themselves are non-negotiable. It’s about giving them agency over the how and the look of the system, which meets their need for autonomy and significantly increases buy-in.
A chart designed for a six-year-old will feel babyish to a nine-year-old and irrelevant to a twelve-year-old. One of the most common reasons chore charts stop working is that they’re never updated — the tasks, the design, and the system stay the same while the child outgrows them. Plan to review and refresh the chart at least twice a year: at the start of each school year and mid-year. Each refresh is an opportunity to add new responsibilities, retire ones that have become habitual, and involve the child in the redesign.
A good chart communicates not just what is expected but what the payoff is. For younger children, this might be a sticker reward system built into the chart — a certain number of completed days earns a reward of their choice. For older children, the reward anchor might be something more abstract: screen time, a privilege, a special activity. Whatever the reward, it should be stated clearly on or near the chart so the child can see the connection between their daily effort and the payoff. This keeps motivation alive in the medium term while internal motivation is still developing.
What Makes a Chore Chart Fail: The Most Common Mistakes
Understanding what goes wrong is just as useful as knowing what to do right. These are the most common reasons chore charts fail — and how to avoid them.
A chart that appears on the wall without context is just another thing for a child to ignore. Before the chart goes up, have a genuine conversation about why it’s going up. Not a lecture — a conversation. What is the chart for? What happens when tasks are done? What happens when they aren’t? What input does the child have? The launch conversation is the moment you create buy-in. Skip it and you skip the most important step.
Parents who are excited about a new system often load the chart with everything they’ve been wanting their child to do for months. The result is a chart that immediately feels overwhelming, produces failure on day one, and gets abandoned. Start with two or three tasks. Add more only once those are consistently done. Success builds momentum. Failure kills it.
A chart without consequences is a suggestion. If incomplete tasks have no reliable outcome — if sometimes there’s a consequence and sometimes there isn’t, or if the parent eventually gives up and does the task themselves — the chart loses all authority. The consequence doesn’t need to be harsh. It just needs to be consistent. Screen time doesn’t happen until chores are done. The reward isn’t earned if the chart isn’t completed. Simple, predictable, every time.
Nothing destroys a chore system faster than a parent who tidies up after the child has ‘done’ their chore because it wasn’t done to their standard. This sends an unmistakable message: your effort isn’t good enough. The child learns that doing the chore to their ability results in the same outcome as not doing it at all — the parent does it anyway. Accept the imperfect result. Lower your standard for what counts as done. A lumpy bed is a made bed.
The same chart for three years is not a system — it’s wallpaper. Children stop seeing what’s always been there. Refreshing the chart periodically — new tasks, new design, new placement — re-engages attention and signals that the system is alive and evolving. A chart refresh is also an opportunity for a new conversation about responsibility and growth, which reinforces the underlying message of the whole system.
A chore chart should never be introduced as a consequence for bad behaviour, used to embarrass a child in front of others, or referenced in a shaming way. The moment the chart becomes associated with punishment or criticism, it loses its function as a neutral, supportive system and becomes something the child resists on principle. Keep the chart positive, matter-of-fact, and entirely separate from discipline conversations.
How to Introduce a Chore Chart: A Step-by-Step Launch Plan
Before anything goes on the wall, spend some time thinking about what will actually work for your specific child. A preschooler needs images and simple tasks. A seven-year-old might love a magnetic slider system. A ten-year-old might respond to a clean, designed chart with dry-erase completion boxes. A teenager might do best with a more minimal, less ‘childish’ format. The chart that works is the one your child will actually engage with, not the one that looks nicest to you.
A customisable chart — one where you can choose the tasks, the design, and the layout to match your child’s age, interests, and personality — is almost always more effective than a generic one. The personalisation itself communicates: this was made for you.
Sit down together, ideally at a relaxed time — not rushed, not right before bed, not in the middle of a conflict. Introduce the chart with enthusiasm and genuine explanation. “We’re trying something new in our house. We’re going to use this chart to keep track of the things we all do to look after our home. I want to show you how it works and hear what you think.”
Walk through each task. Make sure your child understands exactly what each one means. Let them ask questions. If there are elements they can choose — where it hangs, which tasks from a shortlist, what the reward will be — let them make those choices now. End the conversation with something positive: “I think this is going to make things a lot smoother for all of us. I’m really looking forward to seeing how you do.”
On day one, go through the chart together. For each task, make sure your child knows exactly what done looks like. If they’ve never made their bed before, make it together. If they’re not sure how to wipe down the bathroom sink, show them. The standard you demonstrate on day one is the standard they’ll work to. Make it achievable. Then let them mark it complete themselves.
From day two onwards, the goal is to let the chart do the reminding rather than your voice. Instead of “Did you do your chores?” try “Have you checked the chart today?” The language keeps the authority with the system rather than with you. Resist the urge to hover. Check in at the agreed time (before screen time, before dinner, before bed) and acknowledge completion warmly and specifically.
At the end of the first week, sit down for a five-minute review. What worked? What was hard? Is any task unclear or too difficult? What would make it better? This conversation does two things: it gives your child a genuine voice in improving the system, and it communicates that you’re paying attention and taking the whole thing seriously. Make any adjustments needed, deliver the week’s reward if it was earned, and reset the chart for week two.
Keeping the Chart Fresh: How to Sustain Momentum Over Months and Years
The first two weeks of a chore chart system are usually the most successful — novelty drives engagement, the reward feels imminent, and everyone is paying attention. The challenge is month three, month six, and year two. Here is how to keep the system alive long enough to produce real habit change.
A chart that’s been on the same wall in the same spot for a year has become invisible. A new chart — new colours, new layout, new position — draws attention again. You don’t need to change the tasks or the system. Just change what it looks like. The novelty reactivates engagement without dismantling what’s been built.
Each time you add a new task to the chart, you signal something powerful: you trust your child with more. This is genuinely motivating for most children, particularly when the new task is framed as a mark of growing up. “You’ve been so consistent with your current tasks that I think you’re ready for something new. How do you feel about adding laundry to the list?” The conversation itself is a reward.
Build in explicit moments of celebration for sustained effort. A full month of consistent chart completion deserves more than a quiet acknowledgement — it deserves a genuine celebration. A chosen meal, a special outing, a marked moment of recognition. “Do you realise you’ve done your chores every single day this month? That’s thirty days straight. That’s not nothing — that’s genuinely impressive.” These milestone moments build the identity of someone who follows through.
At the start of each school year and at mid-year, schedule a chart refresh session. Sit down together and review: which tasks are so habitual they don’t need to be on the chart anymore? Which new responsibilities is the child ready for? What would make the chart work better? This collaborative review keeps the system evolving alongside the child and maintains their sense of ownership over it.
The most powerful use of a chore chart isn’t the ticking of boxes — it’s the conversations it enables. “I noticed you’ve had the chart completely done every day this week. What does it feel like when you’ve got everything checked off?” “You’ve been taking the bin out without being reminded for two months now. Has that started to feel automatic yet?” These conversations connect the external system to the internal experience, which is exactly the bridge you’re trying to build.
From External System to Internal Habit: The Real Goal
Here is the thing that no one tells you about chore charts: the goal is to make them unnecessary.
A chore chart is a scaffold, not a permanent structure. Like training wheels on a bike, it exists to support a child through the early stages of developing a habit, and the measure of its success is how little the child needs it over time. The end state you’re working toward is not a child who checks the chart every morning — it’s a child who makes their bed because that’s just what they do, who puts their plate in the sink automatically, who hangs up their towel without thinking about it.
That transition — from chart-dependent compliance to automatic habit — takes longer than most parents expect. Research on habit formation suggests that simple behaviours take an average of 66 days to become automatic, with significant variation depending on the individual and the complexity of the habit. For children, who have less developed self-regulation, the timeline may be longer. Expect months, not weeks.
A task has become a genuine habit when your child does it without the chart prompting them, without a reminder from you, and without apparent effort. It simply happens, the same way brushing teeth happens for most children by a certain age — not because they’re thinking about it, but because the body and brain have automated the sequence.
When you notice this happening for a specific task, name it: “Hey, I noticed you just made your bed without even checking the chart. Has that started to feel automatic for you?” This reflection helps the child consciously register the shift, which reinforces the identity change underneath the behaviour.
Once a task is genuinely habitual — done consistently without chart prompting for at least four to six weeks — it can be retired from the chart and replaced with a new, slightly more challenging responsibility. This keeps the chart at the developmental edge: it always contains tasks that are just within reach but not yet automatic. The chart evolves from a beginner’s scaffold to a tool for ongoing growth.
The deepest goal of a chore system isn’t behavioural — it’s identity-based. A child who does chores because the chart says so will stop doing them when the chart disappears. A child who has internalised the identity of someone who takes care of their space and contributes to their household will carry that identity with them throughout life — into share houses, partnerships, workplaces, and eventually their own families.
The chore chart is the entry point to this identity. Every time a child completes a task, marks it done, and receives acknowledgement of their effort, they are building a small piece of that identity. Over months and years, those pieces accumulate into something solid and lasting.
This is why the language you use around the chart matters as much as the chart itself. Not “Did you do your chores?” but “I noticed you’ve been so consistent this week.” Not “You need to tick that off” but “You’re the kind of person who takes care of things — I love that about you.” The chart is the system. The language is the soul of it.
Choosing the Right Chore Chart: What to Look For
With so many chore chart options available — printable templates, magnetic systems, app-based trackers, generic sticker charts, and fully customisable options — it can be hard to know where to start. Here is what to prioritise when making your choice.
Generic chore charts with pre-filled tasks rarely stick, because the tasks don’t match the child’s actual responsibilities, age, and ability. A chart you can customise — choosing the specific tasks, the days they apply, the child’s name, and ideally elements of the design — is always more effective than a one-size-fits-all template. The personalisation drives ownership. Ownership drives engagement.
Children are sensitive to visual quality in a way adults often underestimate. A chart that is well-designed — clear typography, appealing colours, intuitive layout — is one that children want to interact with. A chart that looks like a functional spreadsheet will be treated like one: ignored. Invest in something that looks good on the wall, because it’s going to be on the wall for a long time.
Digital chore trackers have their place, but for most children — especially under twelve — a physical chart with a tangible completion mechanism is significantly more effective. The physical act of marking completion engages the brain’s reward system in a way that tapping a phone screen does not. Look for a chart with dry-erase tick boxes, magnetic sliders, or another hands-on mechanism.
A chart that needs to be reprinted every two weeks is a chart that will be abandoned. Look for something durable — laminated, printed on quality stock, or built with materials that will last months of daily use. The investment in durability pays for itself in consistency.
Chorelist was built specifically to address every one of these criteria. Charts are fully customisable: you choose the tasks, the design, the colour scheme, and the layout. They are professionally printed on high-quality, durable material with a dry-erase surface, so they reset weekly without reprinting. The designs are created with children in mind — visually engaging, age-appropriate, and appealing enough that children actually want them on their walls. And because every chart is built around the specific child and family, the ownership is built in from the moment it arrives.
Thousands of families have used Chorelist charts to transform their household dynamics — not because the chart is magic, but because it does what a great tool does: it makes the right behaviour easier, the wrong behaviour harder, and the whole system sustainable. The science is clear. The design is right. The only variable left is you.
Conclusion: The Chart Is Just the Beginning
A visual chore chart is not the destination. It’s the on-ramp. The destination is a child who has internalised the habits, the values, and the identity of someone who contributes — to their household now, and to every household, team, and community they’re part of for the rest of their life.
That destination takes time and intention. It takes consistency in the face of resistance, patience in the face of imperfection, and the wisdom to know when to hold the line and when to adjust the approach. A great chore chart makes all of that easier. It gives you a system when willpower runs out. It gives your child a structure when self-regulation fails. It gives the whole family a shared language for what contribution looks like.
Start with the chart. Use it consistently. Speak to the identity, not just the task. Watch what happens over months and years. The bed will eventually be made without being asked. The plate will be in the sink without a reminder. The towel will be on the hook. And somewhere in those small, ordinary moments, you will see the person your child is becoming.
That is what the chart is for. And it is worth every bit of the effort it takes to get there.